Getting started
Interface tour
The rail, tabs, status bar, and command palette, plus every default keyboard shortcut.
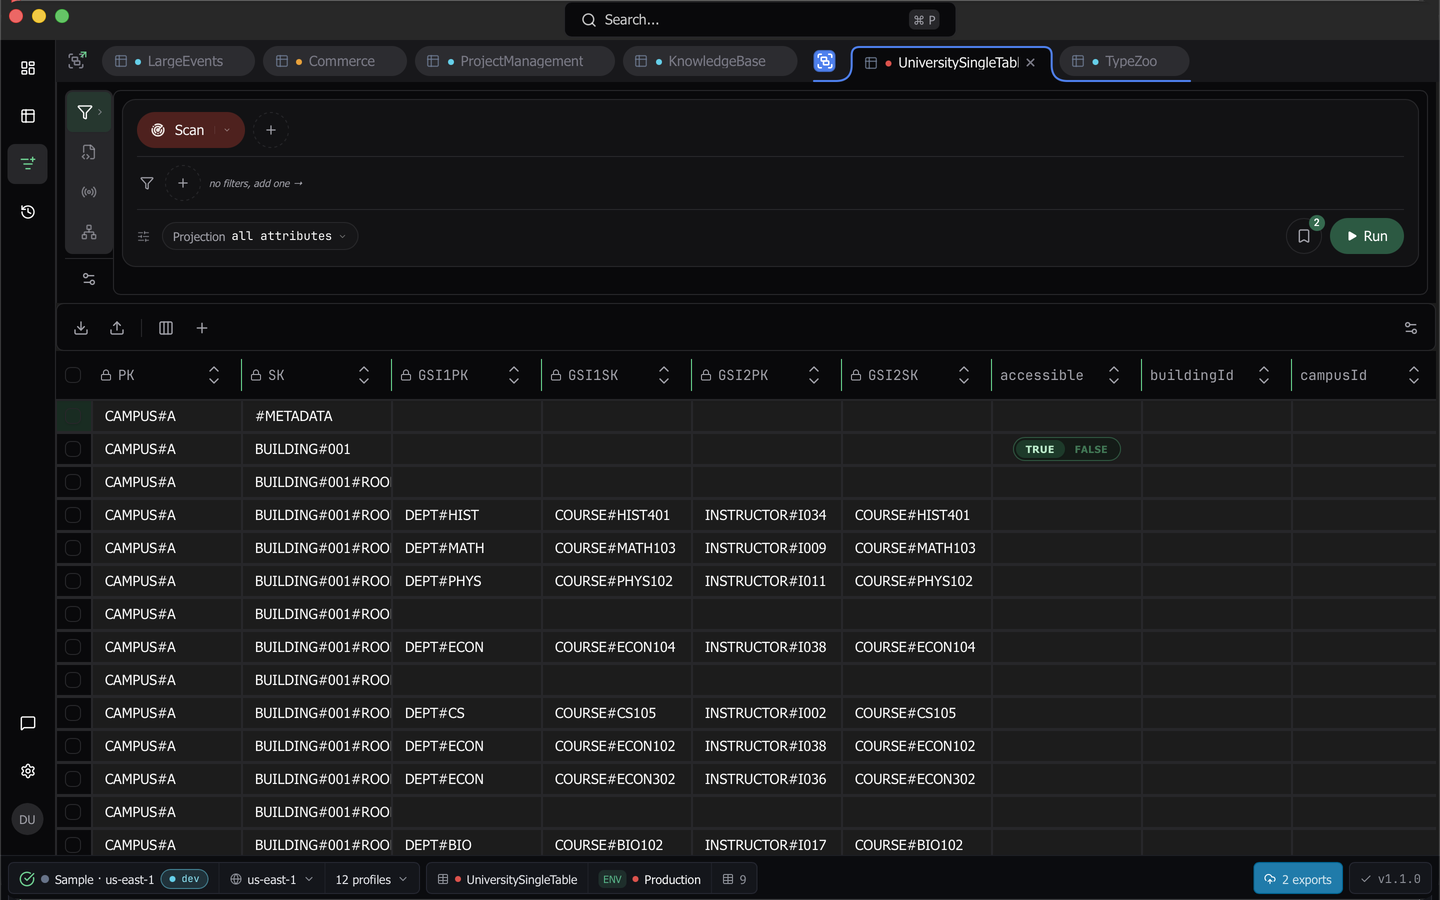
The Dynomatic window has four fixed parts, a left icon rail for navigation, a tab strip for the tables you have open, the work area in the middle, and a status bar along the bottom for connections and activity. This page names each one and lists the shortcuts.
The left rail
The rail never moves. Its top group navigates.
- Dashboard opens the landing page. See Dashboard.
- Tables opens a popover beside the rail rather than a page. See Table browser.
- Query opens the query workspace. See Visual query builder.
- History opens command history, a paid feature.
The bottom group holds Alerts, Feedback, Settings, and the user and account menu. Every button carries a tooltip with its label and its shortcut.
Tabs
Each table you open gets a tab, and each tab carries its own action tabs for Filters, PartiQL, Schema, Scripting, Streams, and Data Model. Tabs can be grouped, reordered, and merged by dragging, and they are restored when you relaunch the app. Closing a tab moves you to a surviving one rather than leaving you on a dead page. See Tabs and groups.
The status bar
The bottom strip is where connection state lives.

On the left it carries the connections group with one row per workspace, an Add Connection button, the profile-count pill, the region pill and its picker, an activity indicator, and a session-elapsed readout. On the right sit the active-table and table-count pills, the sample-mode pill, the S3 export job progress pill, the trial pill, and the app version with its update state. See Connect to AWS.
The command palette
Press ⌘ P on macOS or Ctrl + P elsewhere, or click the search field at the top of the window. The palette fuzzy-searches Tables, Favorites, Tab Groups, Profiles, Actions, and Saved Queries at once.
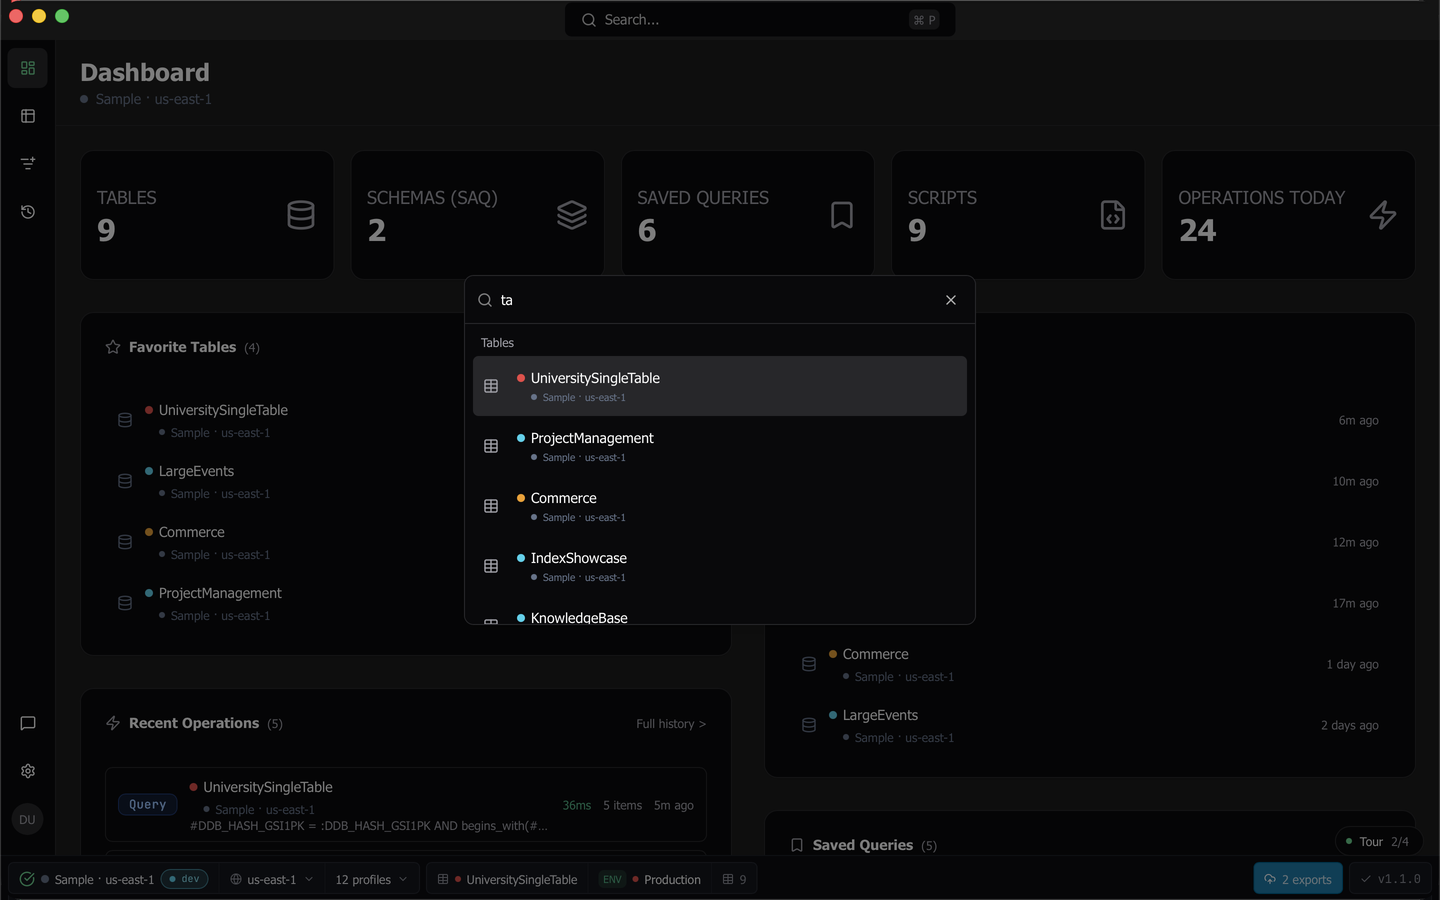
Type a colon-scoped token at the start of the input, or after a space, to narrow the search. The scopes are :fav, :profile, :table, :query, :tabs, and :schema. A committed token clears the input and shows a removable scope badge, and a partial token such as :pr lists the matching scopes as suggestions.
:schema is a two-stage mode rather than a scope. Search entities and access patterns across your imported schemas, pick one, then fill in a parameter form and execute. The right table’s query tab opens in Schema mode with the entity, pattern, and key values already filled in. See Schema-aware query.
Actions include Settings, Refresh Tables, and Manage Schemas, which is how you import your first schema and needs Pro or Team.
Note: The palette shortcut is suppressed while you are typing, including inside the palette’s own input. Press Escape first, or click the search field.
Keyboard shortcuts
These are the defaults. Every one of them is rebindable.
| Action | macOS | Windows and Linux |
|---|---|---|
| Execute Query / Scan | ⌘ Enter or F5 |
Ctrl + Enter or F5 |
| Command Palette | ⌘ P |
Ctrl + P |
| Show Settings | ⇧ ⌘ , |
Ctrl + Shift + , |
| Close Tab | ⌘ W |
Ctrl + W |
| Next Tab | ⌃ Tab |
Alt + Tab |
| Previous Tab | ⌃ ⇧ Tab |
Alt + Shift + Tab |
| Dashboard | ⌘ 1 |
Ctrl + 1 |
| Tables | ⌘ 2 |
Ctrl + 2 |
| Query | ⌘ 3 |
Ctrl + 3 |
| History | ⌘ 5 |
Ctrl + 5 |
| Feedback | ⇧ ⌘ F |
Ctrl + Shift + F |
| Profile | ⇧ ⌘ P |
Ctrl + Shift + P |
| Region | ⇧ ⌘ R |
Ctrl + Shift + R |
To rebind one, open Settings, then Keyboard Shortcuts. Each action can hold more than one combination, the editor captures keys as you press them, conflicts are detected live, and a reset restores the defaults. Shortcuts appear in tooltips and are exposed to assistive technology.
Themes and language
Choose Light, Dark, or System in Settings under General. System follows your OS as it changes, with no flash of the wrong theme at launch.
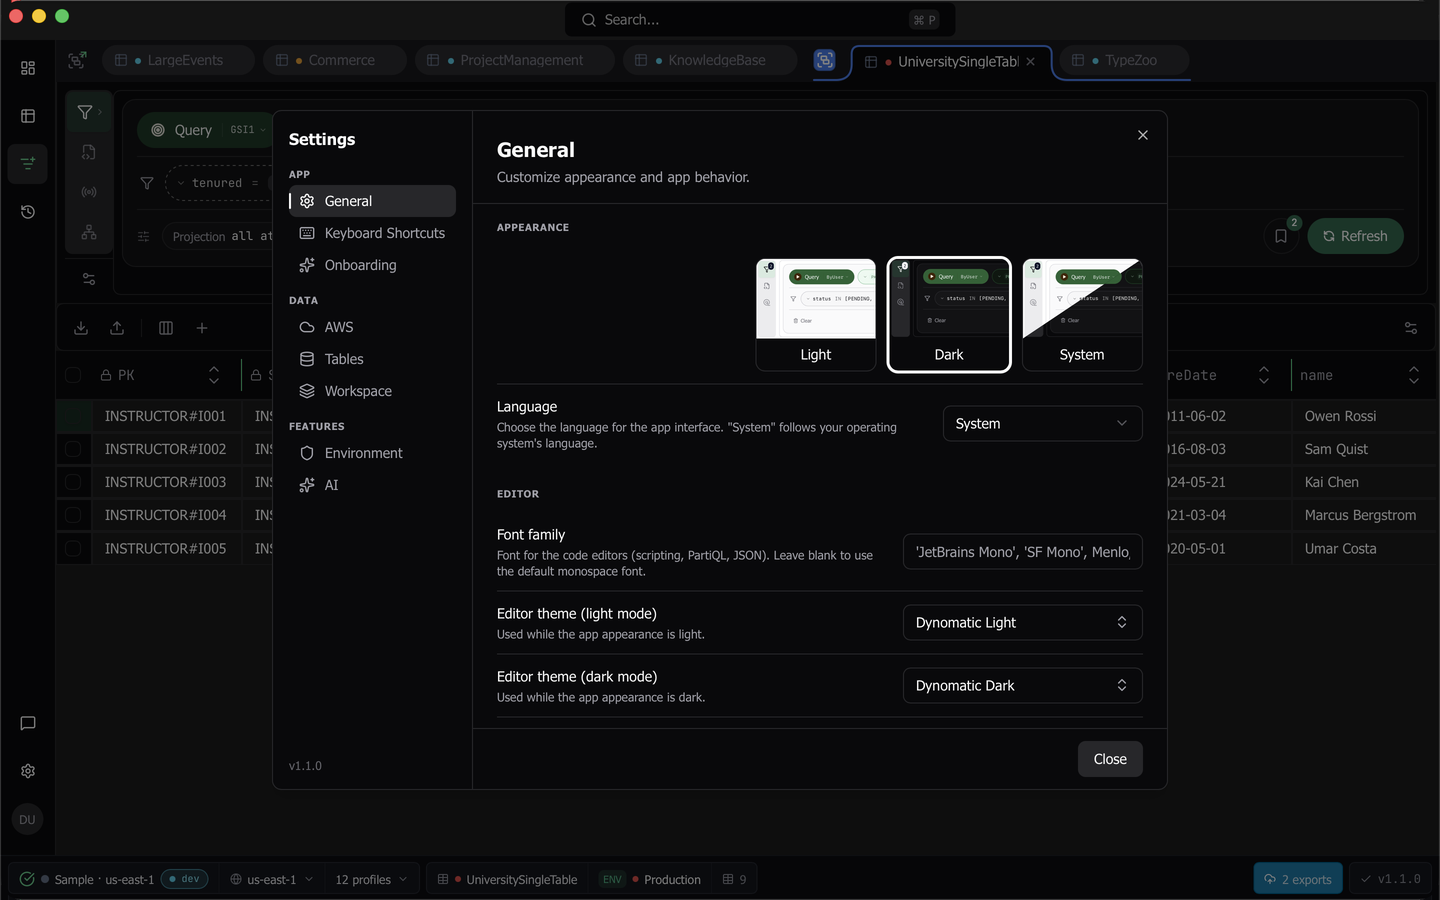
Code editors carry their own theme catalog, with separate choices for light and dark appearance and a live preview as you hover.
The interface is available in English and Japanese. Language resolves from your explicit setting first, then your OS locale, then English.
Onboarding
Three onboarding surfaces help you find your way, and all three reset from Settings under Onboarding.
The Get started panel sits in the bottom-right corner with four milestones, Connect to AWS, Run a query, View your query history, and Try the command palette. Each carries a live shortcut chip, and completion is genuine, so connecting counts only once the connection works. Collapse it to a pill, or dismiss it for good.
Component tours are spotlight walkthroughs over one control group, currently the stream controls, the streams viewer, and the workspace row. They skip steps whose target is off screen, defer while a dialog is open, and exit on Escape.
Page tours are a 21-item checklist spread across the Dashboard, Query, and History pages, completed by the app itself as you do each thing. Each item offers a “Show me” spotlight. Page tours are opt-in on real data and always on in Sample mode.
Last updated on