Tables
Dashboard
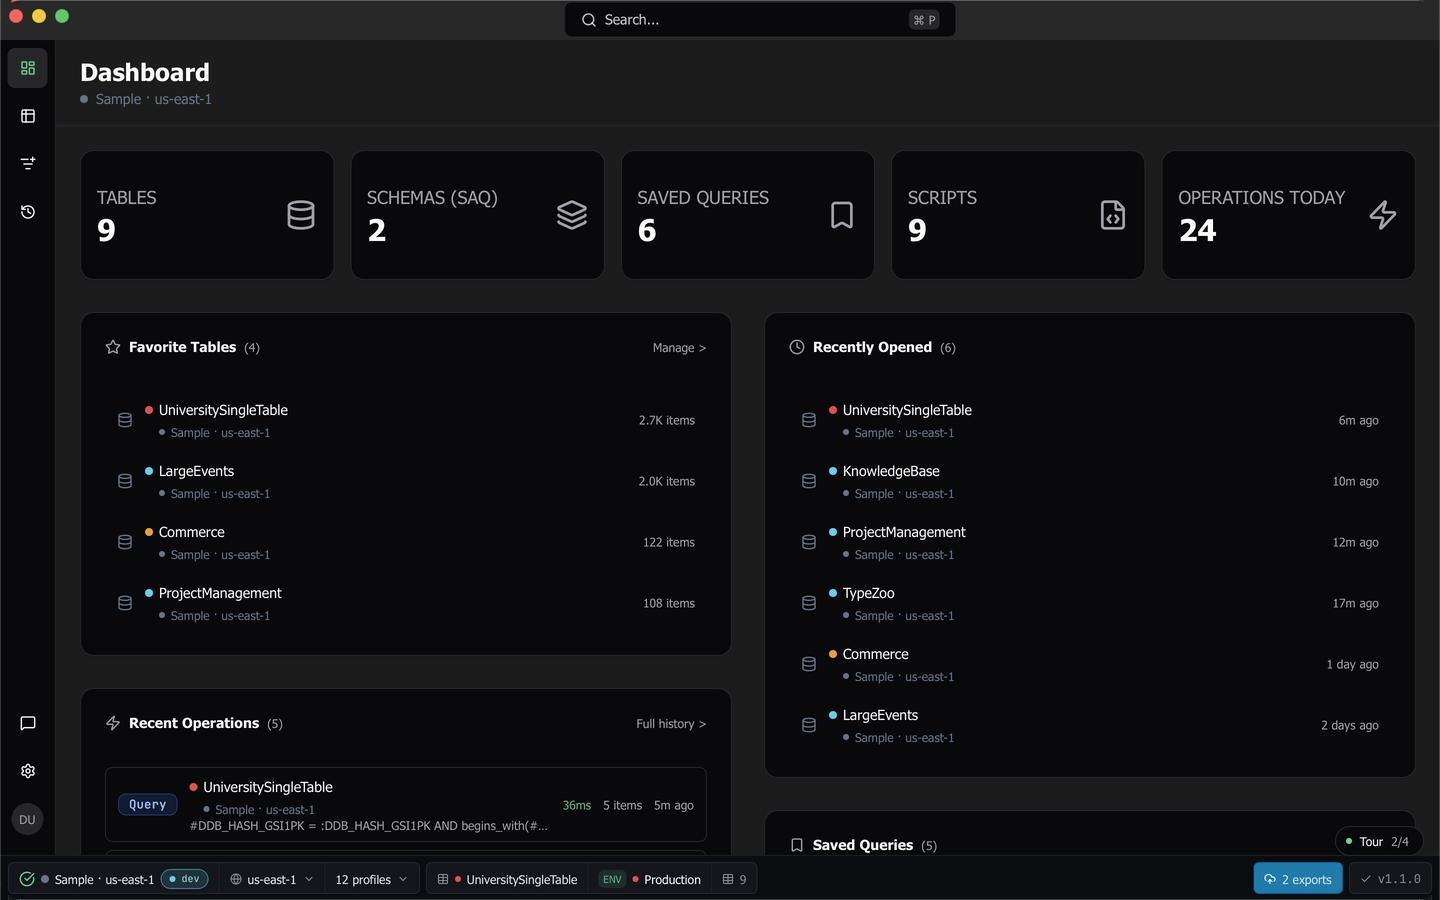
The landing page, with counters, workspace filters, and cards for favorites, recents, and saved work.
The dashboard is where the app opens and where you get back to recent work. It scopes everything to your workspaces, so what you see is what the connections you have open actually own. Press ⌘ 1 on macOS, or Ctrl + 1 elsewhere, to return to it from anywhere.
Counters
A row of five counters sits under the workspace name.
- Tables sums the table count across your open workspaces.
- Schemas (SAQ) counts the schemas you have imported.
- Saved Queries and Scripts count what you have saved.
- Operations Today counts the commands you have run today, and increments as you run them.
The header reads the workspace display name. The raw profile and region pairing behind it is in the tooltip.
Cards
Seven cards fill two columns.
- Favorite Tables lists your starred tables with live item counts. Manage > opens the Tables popover.
- Recently Opened lists the tables you opened most recently, newest first, each with the workspace it came from.
- Recent Operations lists your recent runs. Each row is a button that opens that entry in command history, and Full history > opens the history page.
- Saved Queries and Recent Scripts list saved work in the filtered workspaces.
- Recent Schemas and Saved SAQ Queries list your imported schemas and the queries built on them. See Schema import and schema-aware query.
To reorder the cards, drag one above another. Dragging works with a mouse, with touch, and from the keyboard, and the layout you end up with is saved and restored.
Every card is scoped to the workspace filter, carries its own error boundary, and shows a compact empty state when it has nothing to list. Cards for features you are not entitled to show an upgrade prompt in place of their contents.
Filter by workspace
With two or more workspaces open, a chip group appears in the header with All plus one chip per workspace. Picking a chip narrows the dashboard, and the chips double as a workspace switcher. Move between them with the left and right arrow keys.
The chip narrows five of the seven cards, which are Favorite Tables, Recently Opened, Recent Operations, Saved Queries, and Recent Scripts. Recent Schemas and Saved SAQ Queries are scoped to schemas rather than workspaces, so they ignore the chip.
Note: Rows belonging to a workspace that is not currently loaded are hidden rather than shown without their context. Load that workspace and they come back.
Where to go from here
The dashboard is a starting point rather than a place to work. From here you would usually open a table, either from the Favorite Tables card, from the Tables popover, or from the command palette. Opening a table lands you in the visual query builder.
Last updated on