DynamoDB Streams
Streams viewer
Tail a table's DynamoDB stream live, diff the old and new images of any record, and scroll back through the retained window.
The Streams slot in a query tab tails the table’s DynamoDB stream and shows every Insert, Modify, and Remove as it lands. Use it to watch what your application actually writes, to confirm a deploy is producing the records you expect, or to trace a change back through the retained window after the fact.
Note: The streams viewer is a paid-plan feature.
Open the viewer
The Streams tab appears in the query tab’s rail only when the table reports an enabled stream. To turn a stream on, open Table settings from the rail, go to Capacity, TTL & Streams, choose a view type, and save. DynamoDB locks the view type of an enabled stream, so changing it means turning the stream off, waiting for it to settle, and turning it back on.
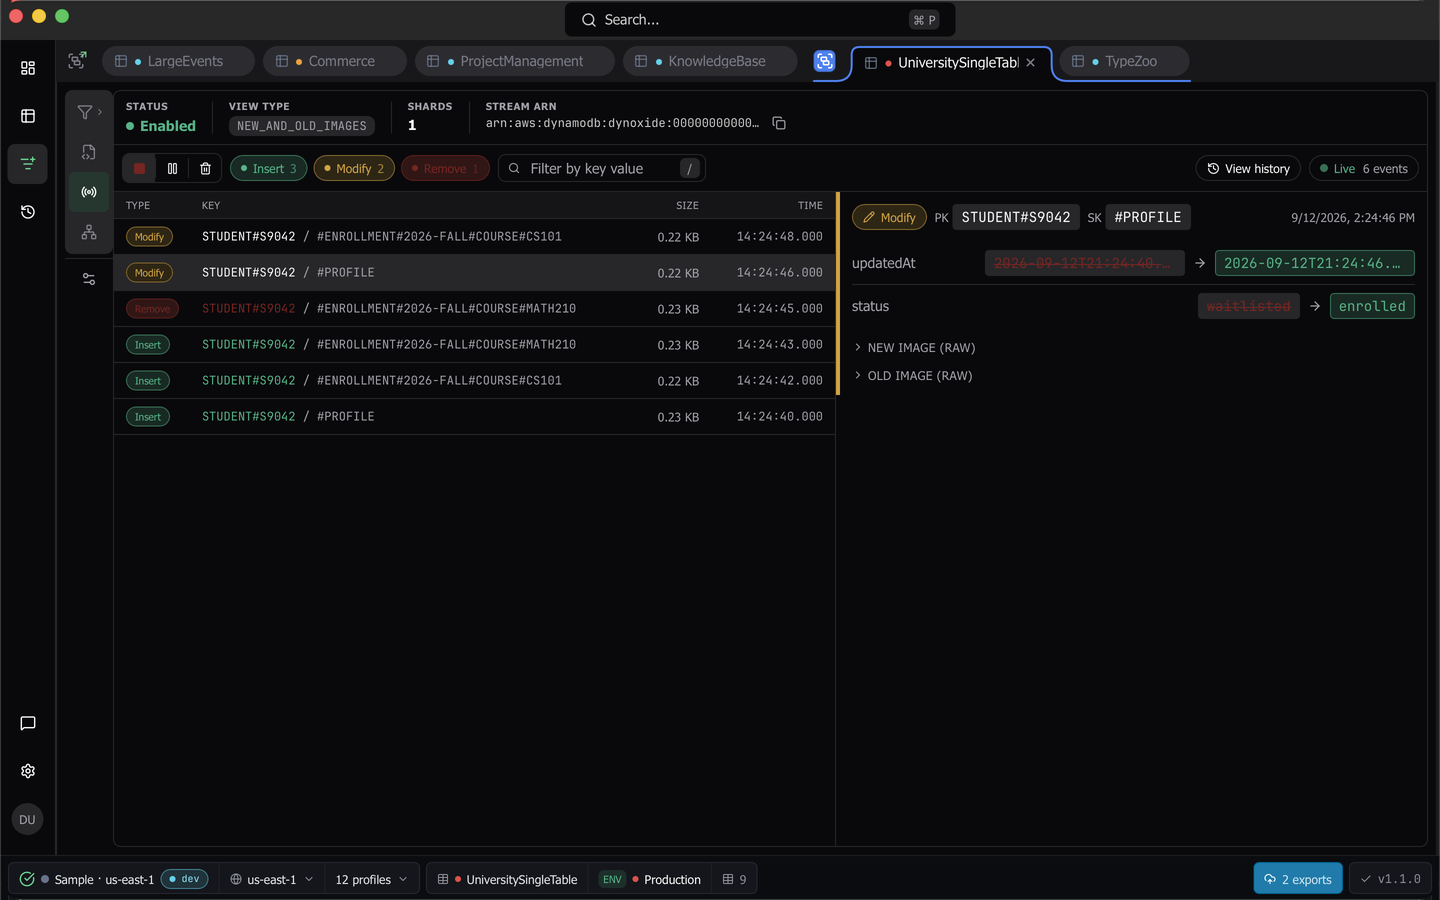
The header names the stream’s status, its view type, its shard count, and its ARN.
Tail the stream
To start the tail, click Start. The status pill reads Live with a running event count, and each record appears as a row carrying its event type, its keys, its size, and its arrival time.
- Pause freezes the list while the buffer keeps filling. The pill reads
Pausedand the count keeps climbing. Resume flushes what arrived. - Clear empties the buffer without stopping the tail.
- Stop ends the tail and returns the pill to
Idle.
Polling is shard aware. Dynomatic keeps a resumable shard-state token, and when a shard splits it enqueues the children, so no records are dropped across a split. The status pill also reports Throttled and Error states when the service pushes back.
Leaving the query tab stops a running tail, so a forgotten viewer cannot keep polling in the background.
Narrow what you see
The Insert, Modify, and Remove chips carry live counts and toggle their event type in and out of the list. The search box next to them filters on key values, and pressing / anywhere on the tab (outside another input) puts the cursor in it.
Read one record
Click a record to open its detail panel. The panel lists the record’s keys, then a diff of the old and new images that recurses into maps and lists and reports each changed leaf at its exact path, such as address.city or tags[1]. Below the diff sit the raw new-image and old-image sections.
A record the TTL sweeper produced carries a TTL expiry badge. On a KEYS_ONLY stream the panel says so and shows no image sections, because only key attributes are captured.
Scroll back through history
View history drains the full retained window (about 24 hours) into a local cache on your machine, then lets you move through it.
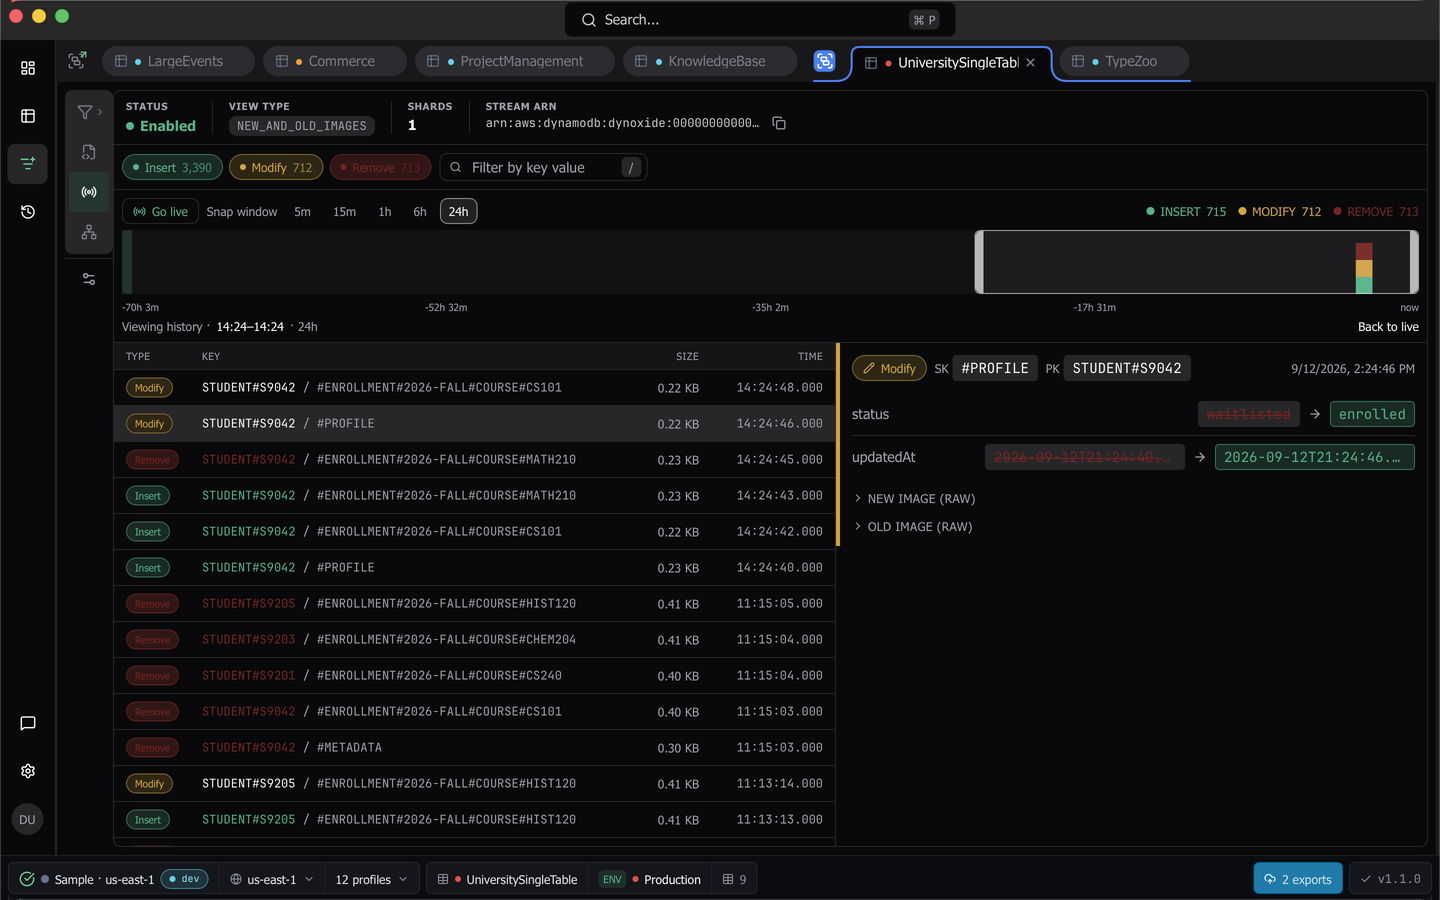
- Click View history. A cost warning explains what the drain reads, and carries a “don’t show again” option.
- Confirm. Loading is progressive and reports its running total, and Cancel stops it at any point. A partial failure is reported rather than hidden.
- Use the stacked event-volume histogram to find the moment you care about. Drag the selection window across it, resize either edge, or use the
5m,15m,1h,6h, and24hsnap presets. - Click Go live to leave history and return to the tail.
Switching away from a tab that is in history mode asks first, because leaving discards the drained window. Cached rows that no tab still owns are swept at the next app start.
Tip: How many records each poll asks for is the stream batch size setting. The global default is in Settings → Tables, and a workspace, an environment, or a single table can override it. The narrowest override wins.
Where to go next
- Query builder for reading the table itself.
- Table settings for turning a stream on and choosing its view type.
- Command history for the record of what Dynomatic sent to AWS.
Last updated on