Querying
Command history
Find, inspect and re-run every DynamoDB operation Dynomatic has sent for you.
Every DynamoDB operation the app runs is recorded automatically, with the expression it sent, the capacity it consumed and how long it took. Use it to work out what a slow query actually asked for, to catch an accidental full table scan, or to run something again without rebuilding it. Command history requires the Pro plan.
Open it
Press Cmd+5 (Ctrl+5), or click History in the nav rail. The dashboard’s Recent Operations card shows the newest five entries and links through with Full history >.
Narrow the list
Filtering happens in two stages. First the filter bar, then the pills.
- The search box matches table names, indexes, expressions, error text, profile names and attribute values.
- The profile, region and table selects each scope to one value.
- The date range offers All time, Last hour, Today, Last 7 days and Last 30 days.
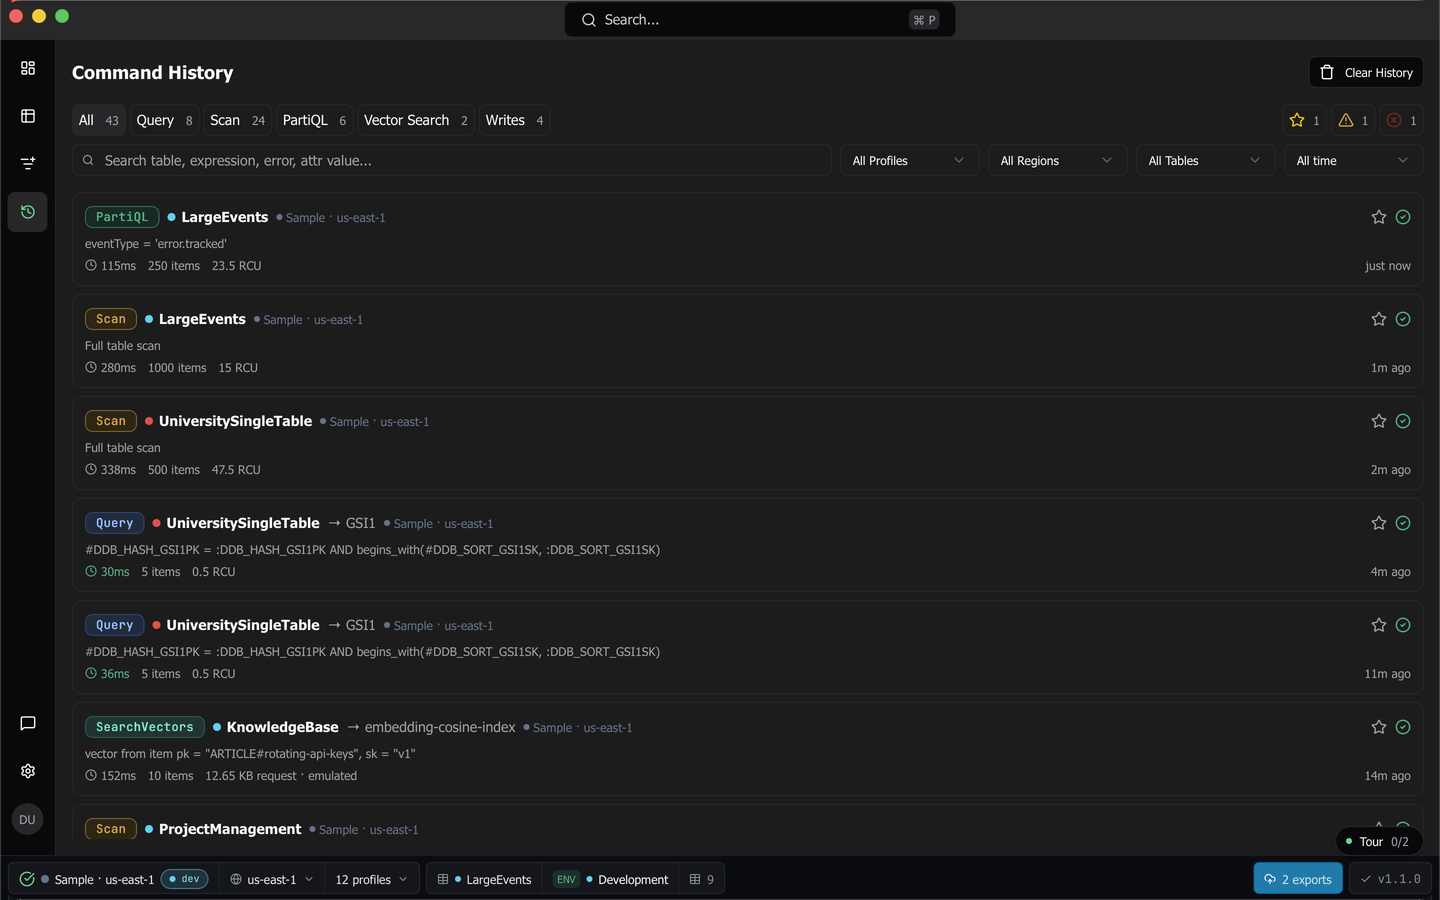
Below the bar, operation pills carry live counts for All, Query, Scan, PartiQL, Vector Search and Writes. Three status pills, Starred, Warnings and Errors, appear only while their count is above zero.
Read a card
Each card is one operation, color-coded by kind. It shows the latency (colored once it crosses a threshold), the item count, the read or write units consumed, the workspace it ran in, an environment dot for that workspace’s tier, and a summary of the expression.
Click a card to expand it. The detail adds the error text where there was one, the raw PartiQL statement, the attribute values that were bound, the fields a write changed, and a wasteful-scan warning when the operation scanned more than twice the items it returned. Three actions sit at the bottom, Re-run, Copy and Delete.
A vector search records a SearchVectors card instead. It names the index and where the query vector came from, either an item’s key, an inline vector with its dimension count, or the text that was embedded and the model that embedded it. In place of read units it reports the request size in bytes, because a vector search costs by request size rather than by capacity. These cards offer no Re-run.
Re-run an operation
Re-run opens a new query tab for the entry’s table and executes it straight away. It re-establishes that workspace’s session first if the credentials have lapsed, including an SSO or MFA prompt, and it runs even when the table’s auto-scan setting would otherwise hold the tab back.
Key and filter expressions are parsed back into builder pills, so the re-run lands as an editable query rather than an opaque replay.
Star what matters
Add to favorites on a card stars it. Starred entries survive Clear History, and the Starred pill filters to them.
Clear history
Clear History opens a confirmation offering Clear filtered (N) while a filter is active, and Clear all history. Starred entries are preserved either way.
History keeps the last 200 entries. Every entry belongs to the workspace it ran in, and removing a workspace removes its entries with it.
Last updated on