Virtual fields
Explore the Orbit sample tables
Follow a satellite through computed columns, related passes and an exact count in Sample mode, then draft a field of your own without saving it.
In this tutorial you read computed and related columns on three seeded tables, follow one satellite to its passes, draft a field with a live preview, and turn a partial count into an exact one. You need no AWS account, and nothing you do here is saved.
The tables belong to Orbit, a small satellite operator in Sample mode. OrbitSatellites holds 12 satellites, OrbitGroundStations holds 6 stations, and OrbitPasses holds each pass of a satellite over a station. They open with their links and fields already saved.
Before you start
Enter Sample mode. On the welcome screen, click Try sample data, or open Settings, then Onboarding. Sample mode lifts every plan gate, so virtual fields work on any plan.
Read the satellites
- Press
⌘ K(Ctrl + Kon Windows and Linux), typeOrbitSatellites, and press Enter. The table opens in a query tab. - If the grid shows no rows, press
⌘ Enter(Ctrl + Enter) to run the scan. Twelve satellites load.
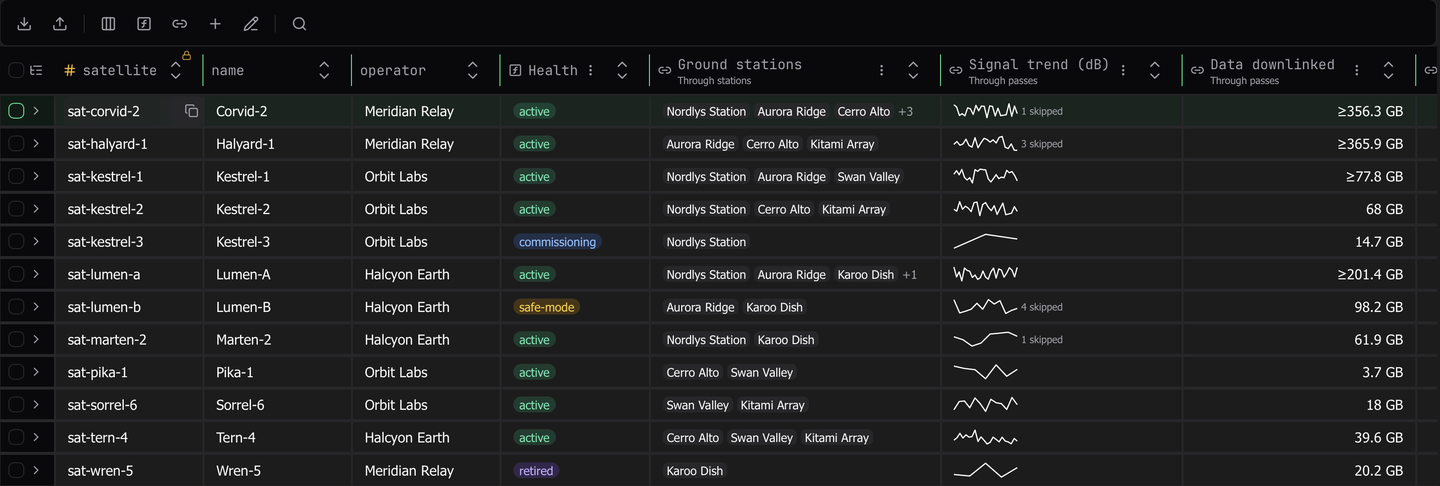
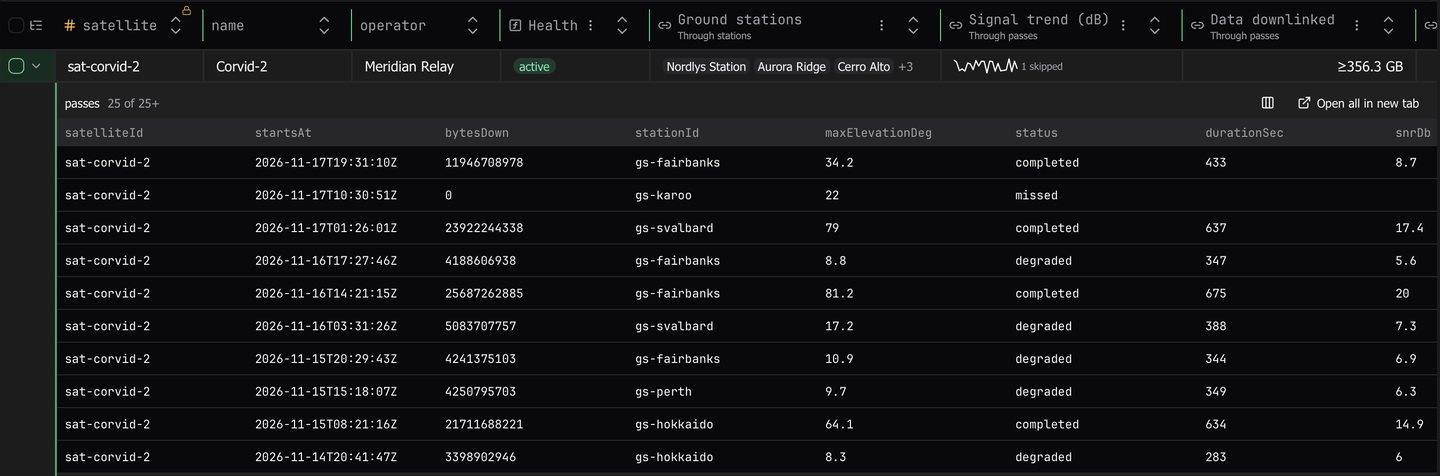
After satelliteId, name and operator, the columns are virtual fields. Health carries the boxed ƒ of a computed column and draws status as a colored badge. Ground stations, Signal trend (dB) and Data downlinked carry a link icon, with Through stations or Through passes under the name. Corvid-2’s Data downlinked reads ≥356.3 GB. The ≥ says the total covers only the first passes Dynomatic read.
Look at the right end of the strip under the Filters builder. Related reads counts what the linked columns read, apart from Actual, the scan itself.

Your numbers can differ. They depend on how many rows were on screen when the reads ran.
Follow a satellite to its passes
-
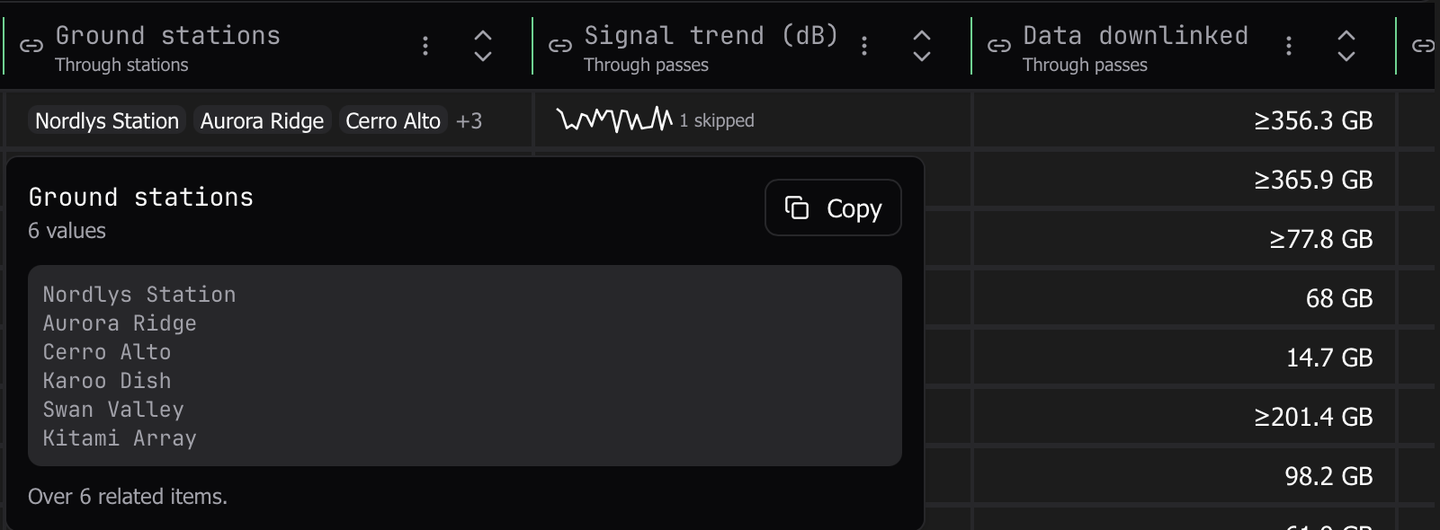
Click Corvid-2’s Ground stations cell. The value viewer opens and lists all six of its stations, past the three chips the column shows.
-
Press Escape, then click Corvid-2’s Signal trend (dB) cell. The peek opens with
passes 25 of 25+. Thepasseslink reads 25 items per row, and Corvid-2 has more.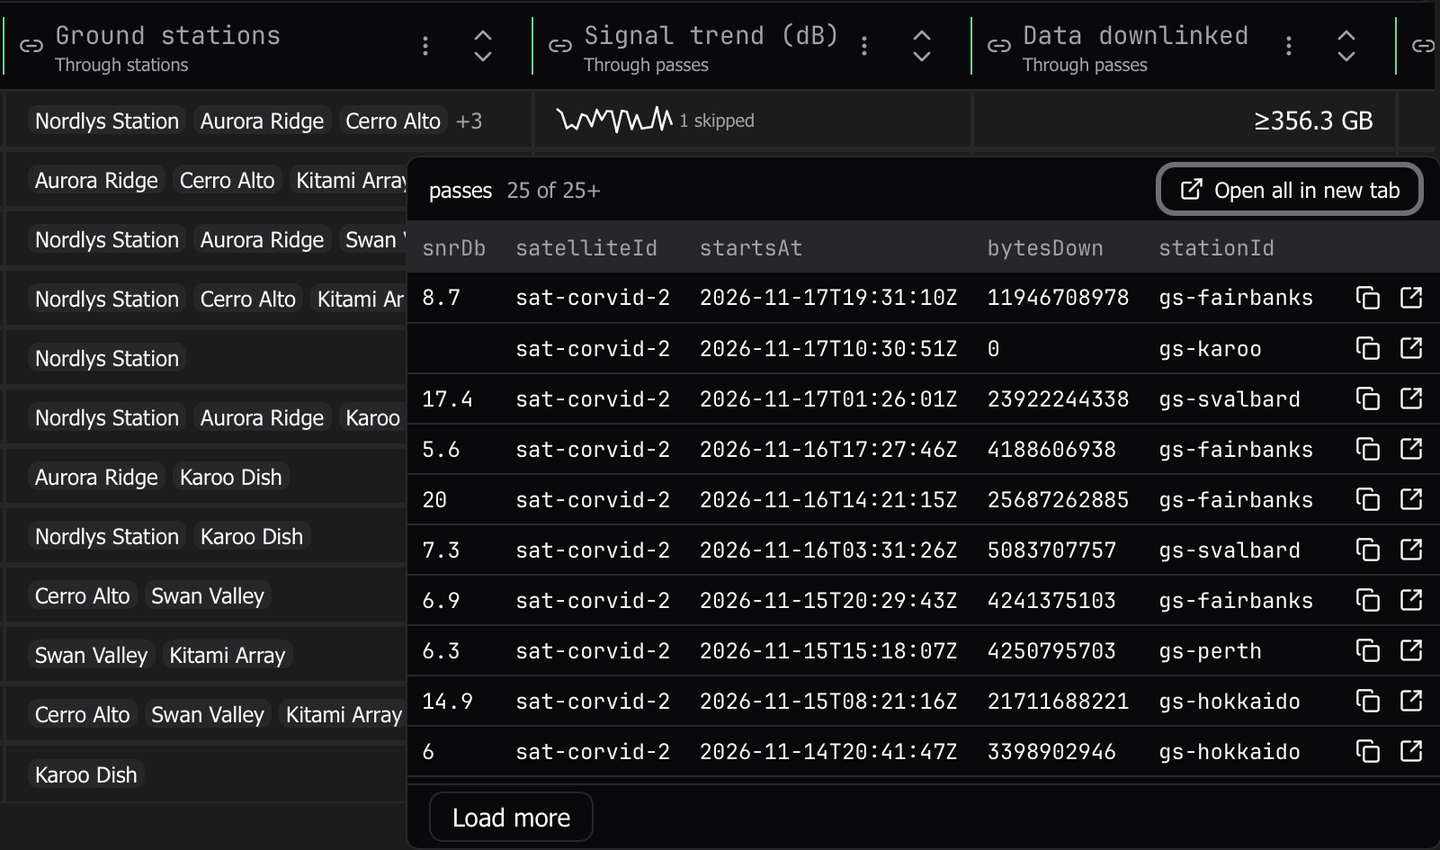
-
Press Escape, then click the chevron at the start of Corvid-2’s row. The same passes open in a sub-grid under the row. Click the chevron again to close it.
-
Open the peek again and click Open all in new tab. An
OrbitPassestab opens with the querysatelliteId = sat-corvid-2and every one of Corvid-2’s passes. The breadcrumb above the grid leads back to Corvid-2’s row.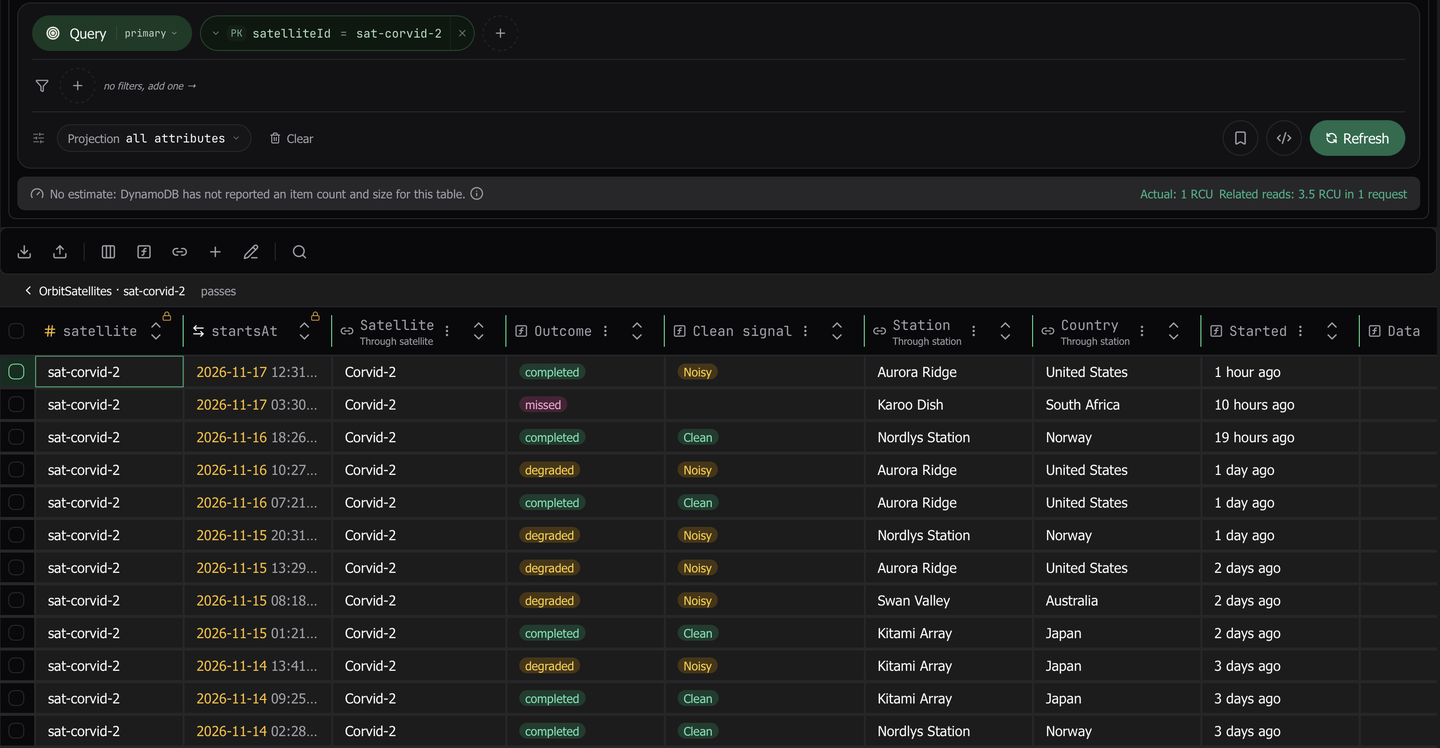
In this tab, Satellite, Station and Country read one item each through the satellite and station links. Outcome and Clean signal are expressions over the pass itself.
See values that depend on the loaded rows
Scroll the OrbitPasses grid to the right. Running total per satellite and Rank by data say Depends on loaded rows under their names. They rank and add up only the passes this tab has loaded, so they would change if more rows loaded.

Draft a field and watch the preview
-
In the
OrbitPassestab, click Virtual fields in the results toolbar, then Add virtual field. The New virtual field dialog opens on the Expression tab. -
In Name, type
Downlink per minute (MB). -
In the expression editor, type
durationSec > 0 ? bytesDown * 60 / durationSec / 1000000. After a moment the preview on the right lists rows with their values, underPreviewing 20 rows. -
Open Format and choose Number. Set Decimal places to
1and turn on Group thousands. The preview redraws every value, such as1,655.4.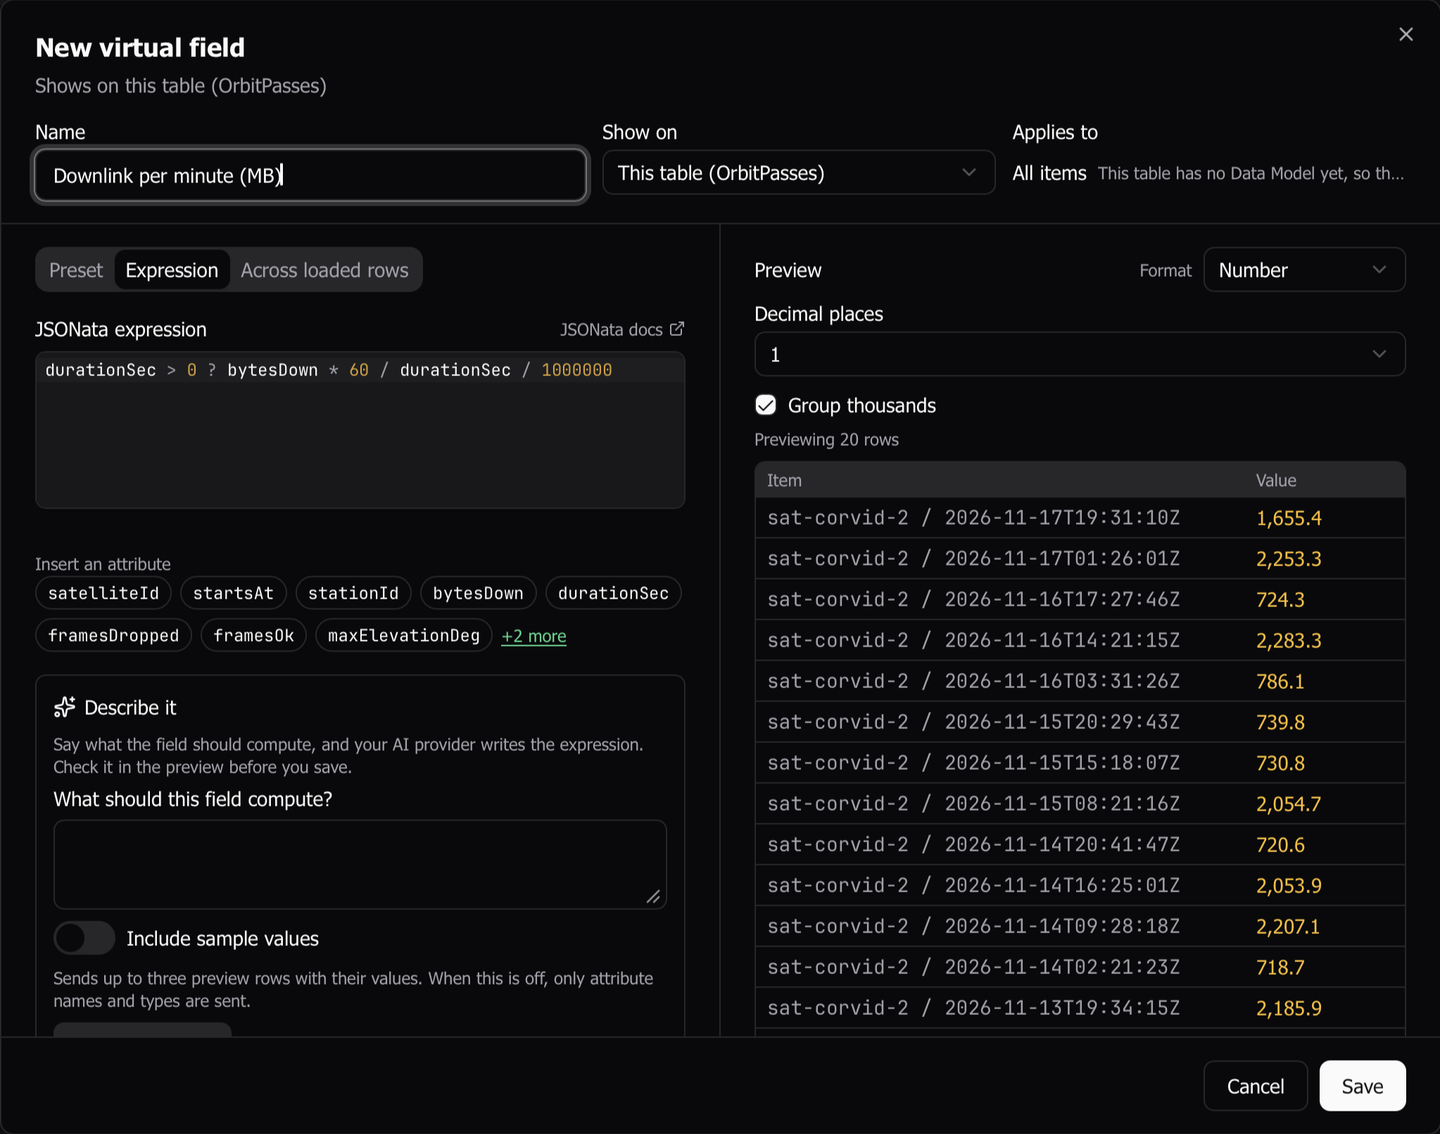
-
Click Cancel. Nothing was saved.
A missed pass has no duration, so the expression gives it no value.
See how a link is built
- Press
⌘ K, typeOrbitGroundStations, and press Enter. Run the scan if the grid is empty. - Click Links in the results toolbar. The menu lists the table’s link,
passes → OrbitPasses. - Click the edit button beside
passes. The Edit link passes dialog opens.
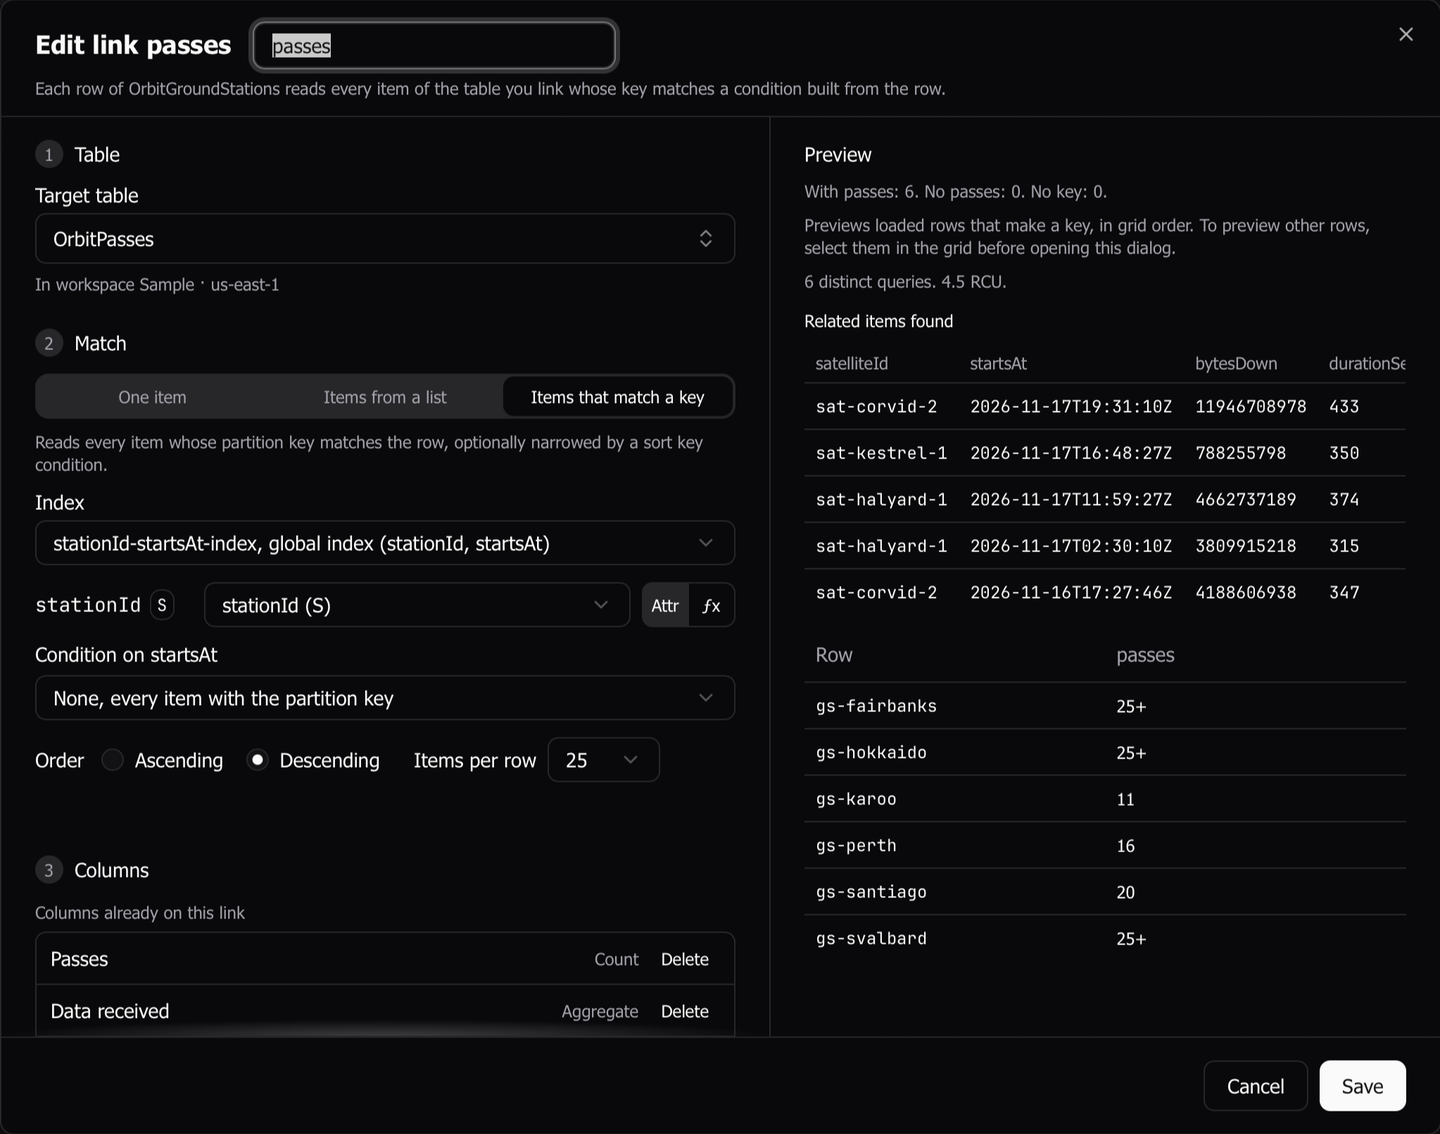
The link reads Items that match a key from OrbitPasses, on the index stationId-startsAt-index, with each station’s stationId as the partition key, newest first, 25 items per row. The preview counts six stations with passes and says the six rows need 6 distinct queries.
- Click Cancel.
Turn a partial count into an exact one
On OrbitGroundStations, Aurora Ridge’s Passes cell reads 25+, because the link read its first 25 passes.

- Right-click Aurora Ridge’s Passes cell.
- Choose Compute Exact. Dynomatic reads the rest of the station’s passes, and the cell reads
57.

Data received still reads ≥186.3 GB. Compute Exact replaces only the cell you ran it on.
What you did
You read a badge field, chips, a sparkline and partial totals, followed one satellite to its passes four ways, drafted a field with a live preview, read a query link’s settings, and made one count exact. Every Orbit field and link is an ordinary one, so you can edit or delete it. Reset in the Sample pill restores them.
Next, create a field on a table of your own, or link another table.
Last updated on